 By
kingsly jebaraj
By
kingsly jebaraj Delivering an app experience that is smooth, responsive, and reliable is a must-have item in the mobile market of today, which is very competitive. No matter whether you are creating an app for startups, enterprises, or consumer products, the role of Android performance optimization is absolutely vital in a way that users will stay engaged and content. This guide demonstrates the ways of using Instruments and other profiling tools to make your app faster, more stable, and efficient—just for Android developers in the USA.
Why Does Android App Performance Optimization Matter?
If an app is slow, uses a lot of battery, or closes unexpectedly, users will most likely delete it in a short timeframe. Android performance optimization is a process through which developers are able to optimize resource utilization, lower loading time, and create smooth interaction flows for users.
Here are some of the reasons performance optimization is very important:
- More user retention and satisfaction
- Better app store ranks
- Less device battery consumption
- More efficient CPU, memory, and network usage
- Improved stability for different types of devices and versions of Android
Introduction to the Instruments Tool
The Android Instruments tool is a must-have for modern debugging and profiling workflows of an app. However, unlike the well-known Instruments tool in iOS development, Android developers nowadays have several robust alternatives like Android Studio Profiler, Perfetto, and third-party instrumenting tools that can be used to accomplish the same goal.
By using the proper app profiling methods, developers can visualize the app behavior they want in real time and are able to discover the issues that are very difficult to spot by manual testing.
Key Features of Instruments for Android Developers
Tools that are similar to Instruments on Android offer developers the capability of:
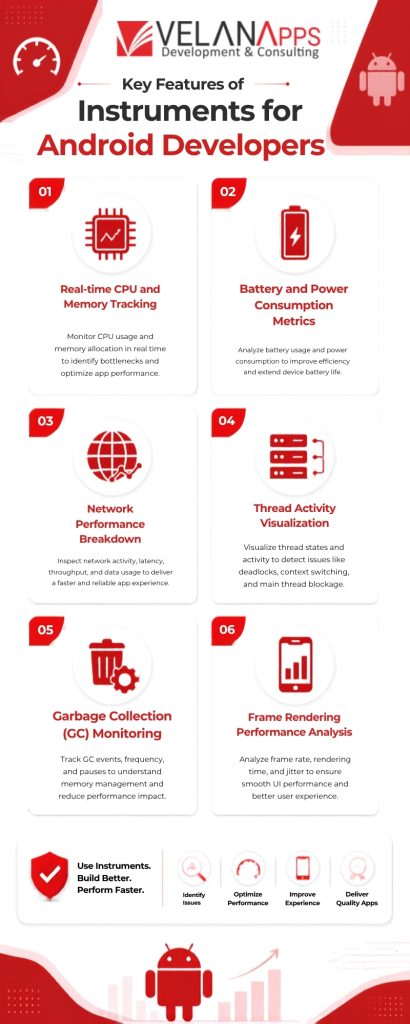
- Real-time CPU and memory tracking
- Battery and power-consumption metrics
- Network performance breakdown
- Thread activity visualization
- Garbage collection (GC) monitoring
- Frame rendering performance analysis
With these features, developers can easily spot inefficiencies and thus have the time to optimize the app’s performance before the release stage.
Step-by-Step Guide to Optimize Performance (How to Optimize Android App USA)
If you are trying to figure out how to optimize an Android app in the USA, this step-by-step approach will assist you in evaluating and upgrading each aspect of your app:
- Android Studio Profiler or Instruments-like tools to record CPU, memory, and network activity.
- First, look for background tasks that hog resources or slow down the main thread. They’re often the reason your app feels sluggish.
- Detect memory leaks, overuse of bitmaps, or that certain objects are not being dereferenced.
- Look for inefficient APIs, redundant calls, or large payloads that slow down the network.
- Activate your GPU profiler and verify that your program maintains a frame rate of 60 frames per second. Your animations will appear choppy if the frame rate decreases.
- Don’t just guess—use automated tests, load testing, and profile your app on real devices. That’s the only way to be sure your app actually performs well everywhere.
- Memory leaks are usually the culprits of slowdowns, crashes, and excessive battery usage. In general, LeakCanary, Perfetto, and Android Studio Memory Profiler are the tools that assist in locating the objects that are retained for too long.
CPU bottlenecks are most often caused by:
- Operation running for a long time on the main thread
- Inefficient loops
- Unoptimized third-party libraries
- IO tasks that are blocking
By the use of profiling tools, developers can find out which methods are slow, get a graphical representation of thread usage, and move heavy work to background threads.
Common Android App Performance Issues in the USA
For Android developers in the USA, performance issues may depend on the user demographic, device diversity, and connectivity patterns. Few of the problems are as follows:
- Stuttering on Android devices which are of mid-range or older
- Variation in network speed in different places—sometimes it was slow or loading
- Intensive use of GPS leads to heavy battery drain
- Memory-related crashes due to multitasking
- There is inconsistency across the device ecosystem.
Resourcing and Good Practices for Android Optimization
A handful of tools and practices can go a long way in optimizing your Android app for performance.
Tools:
- The go-to for tracking CPU, memory, and network activity.
- Dig deep into system traces to spot bottlenecks.
- Get real-time insights right from your users’ devices.
- Catch memory leaks before they slow down your app.
- See how your UI draws and where it lags.
- Watch out for how much time your app is using data and taking network calls.
Best Practices:
- Move the heavy task into background threads to make your application responsive and able to interact with the user smoothly.
- Reduce those overdrawn chunks and extra work for the GPU; nobody likes a jittery screen.
- Optimize your images; bloated assets will weigh you down!
- Cache network responses smartly, so you don’t waste time or data.
- Wake locks should be avoided if possible. If you really need them, be aware that they are battery power consumers.
- Performance testing must be done regularly, and you should also use Android’s performance testing guide to be able to identify problems at their initial stage.
Final Thoughts—Building Faster, Smoother Android Apps
Making your app perform better isn’t just about checking a technical box. It’s how you stay ahead. With the right tools, smart profiling, and regular testing, your app feels fast and reliable on any Android device in the U.S. Developers who focus on performance build apps that people actually want to use—and keep using.
FAQs about Android Performance Optimization
1. What is Android performance optimization?
This is primarily focused on optimizing your app to run faster, consume less battery power, and maintain stability. Profiling tools and a sprinkling of best practices get you to that point.
2. What are the best profiling tools for Android?
Android Studio Profiler, Perfetto, Firebase Performance Monitoring & LeakCanary. These are the standards.
3. What is the Android Instruments tool?
These are the tools that monitor your CPU, memory, and network usage so you can identify and correct bottlenecks.
4. How do I get your answer on finding memory leaks in android?
You can use LeakCanary or Android Memory Profiler. They display the objects, that never get a release.
5. How do I optimize an Android app for better performance in the USA?
Profile your app, move heavy work off the main thread, cut down on network usage, save battery, and test performance every step of the way. Stick with Android’s performance guide to stay on track.